
EN

Book a demo

EMEA Parloa Consumer Patience Index 2026

One bad experience, and your customer
is gone.

One bad experience, and your customer
is gone.

EN

Book a demo

EMEA Parloa Consumer Patience Index 2026

One bad experience, and your customer
is gone.

Key statistics

Key statistics

We surveyed 757 consumers about their frustrations, their patience thresholds, and their expectations for automated support. What we found was a population desperate for better automated support that they know is possible.

say their service experience directly impacts brand loyalty.

90%

say their service experience directly impacts brand loyalty.

90%

say feeling understood influences their satisfaction with automated support.

92.1%

say feeling understood influences their satisfaction with automated support.

92.1%

say IVR fails to consistently resolve their issues.

93%

say IVR fails to consistently resolve their issues.

93%

would keep using automation if it solved their issues reliably.

84.7%

would keep using automation if it solved their issues reliably.

84.7%

Finding 01 — The patience window

Automation has

five minutes.

Automation has

five minutes.

Automation has five minutes.

Long wait times took the #1 position for consumers’ most frustrating support experiences.

79.1%

of consumers say they’ll wait up to five minutes before demanding a human agent. 60% of that percentage will wait only three minutes.

50.5%

of consumers say they’ll deploy tactics on automation to be routed to a human faster.
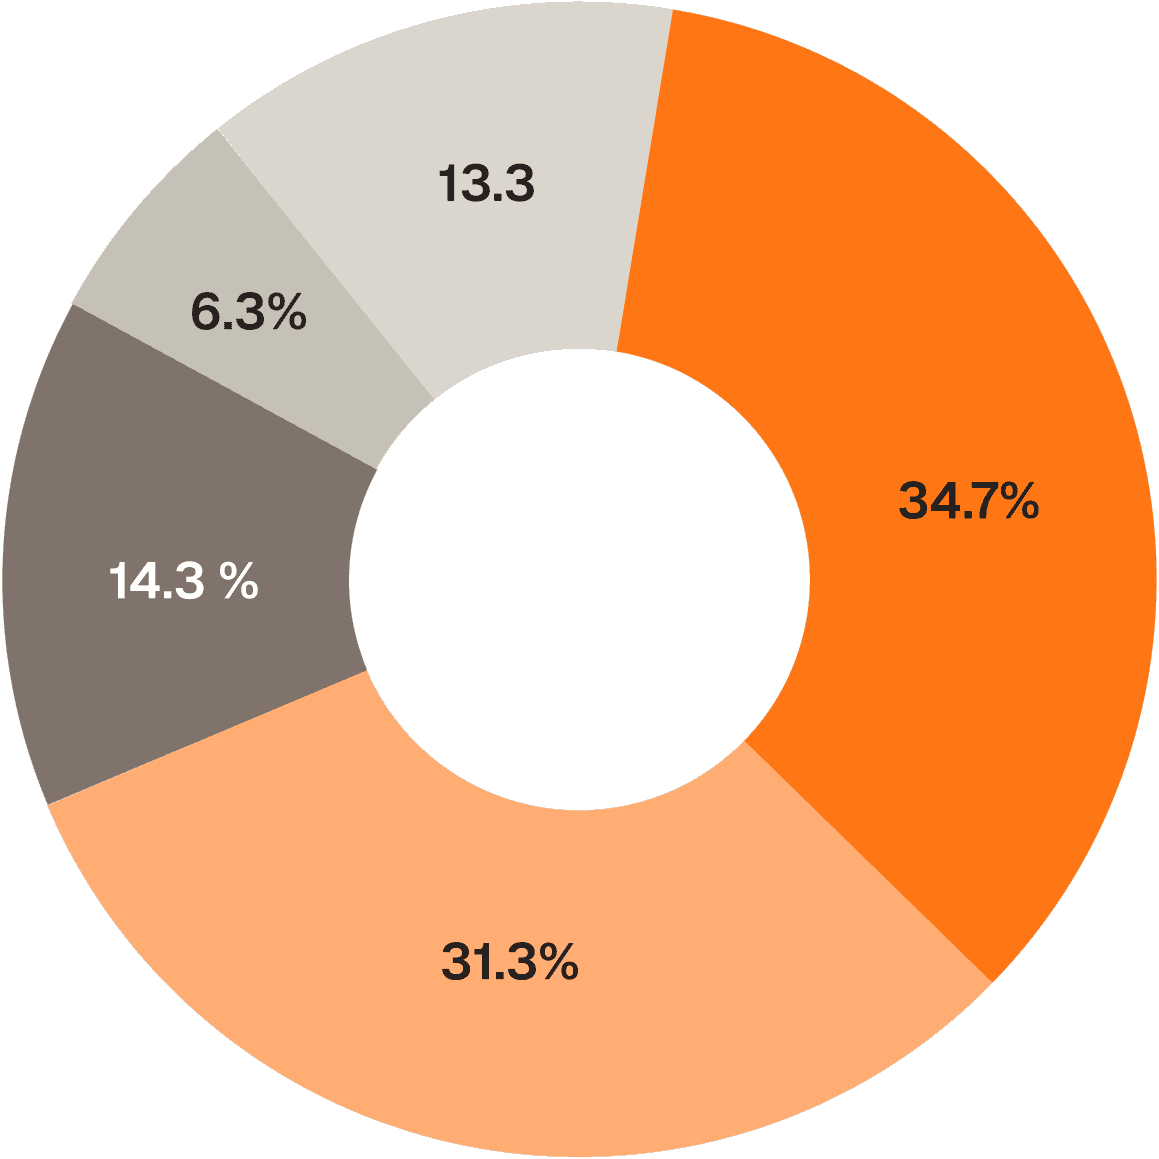
Donut chart: how long consumers will interact with an automated assistant before demanding a human agent

When faced with an automated assistant, how long are you willing to interact before demanding a human agent?


Under 1 minute

1-3 minutes

3-5 minutes

5-10 minutes

10+ minutes

Under 1 minute

1-3 minutes

3-5 minutes

5-10 minutes

10+ minutes

Finding 02 — The comprehension gap

Empathy leads to loyalty. Most brands are missing both.

Empathy leads to loyalty. Most brands are missing both.

92.1%

of respondents said feeling understood influenced their satisfaction with automated support.

With 90% of consumers saying a brand’s customer experience influences how they perceive a company, this feeling of comprehension carries immense capital.

How important is “feeling understood” (for example, empathy or tone) to your satisfaction with automated support?

extremely important

43.9%

somewhat important

48.2%

not important

7.9%

How important is “feeling understood” (for example, empathy or tone) to your satisfaction with automated support?

extremely important

43.9%

somewhat important

48.2%

not important

7.9%

Finding 02 — The comprehension gap

Empathy leads to loyalty. Most brands are missing both.

92.1%

of respondents said feeling understood influenced their satisfaction with automated support.

With 90% of consumers saying a brand’s customer experience influences how they perceive a company, this feeling of comprehension carries immense capital.

How important is “feeling understood” (for example, empathy or tone) to your satisfaction with automated support?

extremely important

43.9%

somewhat important

48.2%

not important

7.9%

Finding 03 — The technology gap

Consumers know what companies are failing to deliver.

Consumers know what companies are failing to deliver.

Consumers know what companies are failing to deliver.

When asked how confident consumers are that automated support solutions can understand and resolve requests accurately, 75.6% of respondents said they were at least somewhat confident. And 55.2% said they were comfortable using it before talking to a human.

Yet just 6.6% of respondents said IVR consistently resolves their issues. For the other 93.4%, the experience ranges from partial effectiveness to complete failure.

How often do you feel the IVR phone menu actually supplies options that meet your needs?

How often do you feel the IVR phone menu actually supplies options that meet your needs?

How often do you feel the IVR phone menu actually supplies options that meet your needs?

Donut chart: how often the IVR phone menu supplies options that meet consumers' needs

6.6%

Always – I don’t have issues with this style of automation. It resolves my concerns.

12.8%

Never – the pre-scripted options are useless.

39.6%

Sometimes – but rarely can an automated menu resolve my issue fully.

41.0%

It depends – easier issues get resolved easily, but complex issues break down.

Finding 04 — The emotional support tax

Bad CX doesn’t just cost current customers, it costs future revenue too.

Bad CX doesn’t just cost current customers, it costs future revenue too.

Bad CX doesn’t just cost current customers, it costs future revenue too.

After experiencing bad customer experience, 34.2% of respondents reported switching brands. 24.8% of consumers also said they’re likely to leave a brand after just one bad support experience.

47.8% also reported telling family and friends about it, threatening the brand loyalty of people who may not have even had the chance to become a customer yet.

Have you ever done any of the following after a bad customer experience? Please select all that apply.

Told friends or family

362

Switched brands

259

Avoided contacting support again

238

Complained publicly

147

None of the above

122

Finding 05 — The agentic enthusiasm

Consumers are ready for what comes next.

Consumers are ready for what comes next.

Consumers are ready for what comes next.

Despite what they’ve experienced so far, consumers are confident AI can do better for them, and they’re ready for it.

75.2% of respondents believe that future AI systems will handle complex service requests better than humans. 69.5% also reported interest in using AI assistants that personalize service based on their history and preferences, while 79% said they would prefer automated service that anticipates their needs and is proactive.

How much do you trust that future AI systems (voice or chat) will handle complex service requests better than humans?

How much do you trust that future AI systems (voice or chat) will handle complex service requests better than humans?

How much do you trust that future AI systems (voice or chat) will handle complex service requests better than humans?

Donut chart: how much consumers trust future AI systems to handle complex service requests better than humans

14.9%

Complete trust

27.5%

No trust

57.6%

Somewhat trust

Looking forward

The gift of high expectations

The gift of high expectations

Consumer expectations for automated customer experience have never been higher. Knowing the technology available, consumers want real-time, reliable, secure service, and they’re willing to switch brands to get it. The Consumer Patience Index paints a picture that CX leaders can’t afford to look away from. The cost of bad customer service, measured not only in churn, but also stalled revenue, is high. The good news is, brands don’t have to guess. This survey outlines exactly what brands need to deliver in order to earn customer loyalty. With the right AI in place, all of these expectations can be met.

But time is of the essence. With the volume of vendors available across industries today, customers don’t need brands. One bad experience, and they’ll just move on to the next. The companies that act quickly to meet consumer expectations will be the ones who successfully transform their support channels from being sources of churn to engines for revenue.

Are you ready to set the new standard for high-quality customer experience in your industry?

Methodology

This survey was commissioned by Parloa and conducted by independent research firm Propeller Insights in Summer 2026, with a sample of more than 750 consumers over the age of 18, residing in the United Kingdom, Ireland, France and Germany, and who had interacted with a company’s customer service department in the prior 12 months. Data was collected via an online survey instrument.